Power BI Nedir? İş Zekası Rehberi
Power BI, günümüzde işletmelerin en değerli hazinesi olan verileri anlamlandırmak için kullanılan güçlü bir iş zekası aracıdır. Veriler tek başına kıymetlidir ancak onları işleyip anlamlı hale getirmek, doğru araçlarla mümkündür. İşte tam da bu noktada Microsoft’un geliştirdiği Power BI devreye girer. Bu etkileyici platform, verilerinizi etkili bir şekilde görselleştirmenizi, derinlemesine analiz etmenizi ve karar alma süreçlerinizi hızlandırmanızı sağlar.
What is Power BI?
Power BI is a business intelligence platform developed by Microsoft. Its main purpose is to transform raw data into meaningful insights and present these insights through interactive reports, visuals and dashboards. It allows you to analyze by pulling data from different data sources (such as Excel, SQL Server, cloud-based systems ). Thanks to its user-friendly interface, even non-technical people can easily analyze data.
Power BI has three main components:
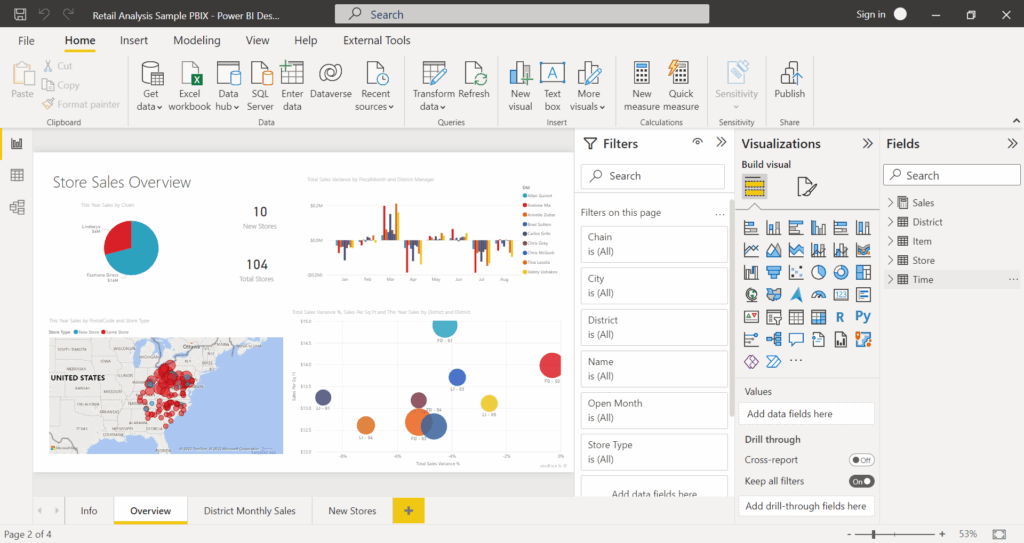
Power BI Desktop: A free desktop application. Used to create reports and visualizations.
Power BI Service: A cloud-based platform. Used to share reports, collaborate and view dashboards.
Power BI Mobile: Mobile application developed for iOS and Android devices. It allows you to access reports from anywhere.
It is suitable for businesses of all sizes, from small enterprises to large corporations, and supports data-driven decision-making.
Key Features
What sets it apart from its competitors are its powerful features and flexible structure. Here are the highlights:
1. Data Connectivity and Integration
Power BI can connect with hundreds of data sources. It seamlessly integrates with platforms such as Excel, CSV files, SQL databases, SharePoint, Salesforce, Google Analytics and Azure. This allows you to combine and analyze data from different sources in one place.
2. Interactive Visualizations
A wide variety of chart types are available to visualize your data: bar charts, pie charts, maps, line charts and more. Users can customize these visuals and make them interactive. For example, you can click on a graph to see the details of the data.
3. Drag-and-Drop Interface
Its user-friendly interface allows you to create reports without coding knowledge. You can select data fields and create visualizations by drag-and-drop.
4. DAX (Data Analysis Expressions)
The app uses a formula language called DAX for complex data analysis. With DAX you can perform custom calculations, create filters and gain deeper insights from your data.
5. Automatic Updates
When you upload your reports to the cloud with Power BI Service, they are automatically refreshed as your data sources are updated. This ensures that you always have access to up-to-date information.
6. Artificial Intelligence and Machine Learning
The application is equipped with artificial intelligence features. For example, you can perform trend analysis, detect anomalies in data, or analyze data with natural language queries (e.g. “How are sales this month?”).
Usage Areas
It has a wide range of uses in different sectors and business processes. Here are some examples:
1. Sales and Marketing
Sales teams can analyze customer behavior, monitor sales performance and evaluate campaign results. For example, a marketing manager can visualize which advertising channel generates the highest return.
2. Financial Analysis
Finance teams can use it for budget planning, expense tracking and revenue analysis. Complex financial data such as cash flow reports or profitability analyses are easily visualized with Power BI.
3. Operations and Supply Chain
It can be used to monitor stock levels, supply chain performance and operational efficiency. For example, a logistics company can use application reports to optimize delivery times.
4. Human Resources
HR departments can use it to analyze employee performance, recruitment processes and employee satisfaction. For example, an HR manager can identify trends by visualizing employee turnover.
How to use it?
You don’t need a technical background to start using it. Here is a step-by-step guide to getting started:
1. Download the desktop app
Download Power BI Desktop for free from Microsoft’s official site. Once the installation is complete, you can open the application and start analyzing the data.
2. Connect Data Sources
Use the “Get Data” option to load data. You can select data from Excel, SQL Server, Google Analytics or any other source.
3. Create Reports and Visualizations
After uploading your data, create charts and tables using the drag-and-drop interface. You can customize your reports by adding filters.
4. Share Reports
You can share the reports you create with your team by uploading them to Power BI Service. With Power BI Mobile, you can access these reports from anywhere.
5. Benefit from Training and Resources
Microsoft offers a comprehensive learning center for Power BI. You can also find many free tutorials on YouTube and blogs.
Advantages and Disadvantages
Advantages
User Friendly: Can be used without technical knowledge.
Flexibility: Works with a wide range of data sources.
Affordable Cost: The Basic model is free, while the Pro model offers an affordable subscription.
Powerful Integration: Perfectly aligned with the Microsoft ecosystem (Azure, Office 365).
Disadvantages
Beginner Difficulty: DAX and complex data modeling can be challenging for beginners.
Performance: Performance issues may occur with very large data sets.
Cloud Dependency: Some features are only available with Power BI Service.
Transform Business Intelligence with Power BI
This analysis tool is a powerful tool that accelerates the data-driven decision-making processes of businesses. With its user-friendly interface, wide range of integration options and AI-powered features, it offers an indispensable business intelligence solution for businesses of all sizes. Whether you want to increase your sales or optimize your operations, this tool gives you the opportunity to discover the power of your data.